
Breakout Bull is SwissBot's fully automated gold strategy. Before a strategy goes live, it has to prove itself over many years and very different market phases. Here you'll find the complete backtest covering more than 11 years. It spans the COVID crash, the interest-rate turnaround and several gold bull markets, and it shows every losing phase.
All figures: backtest from 2 January 2015 to 2 April 2026, not live performance.
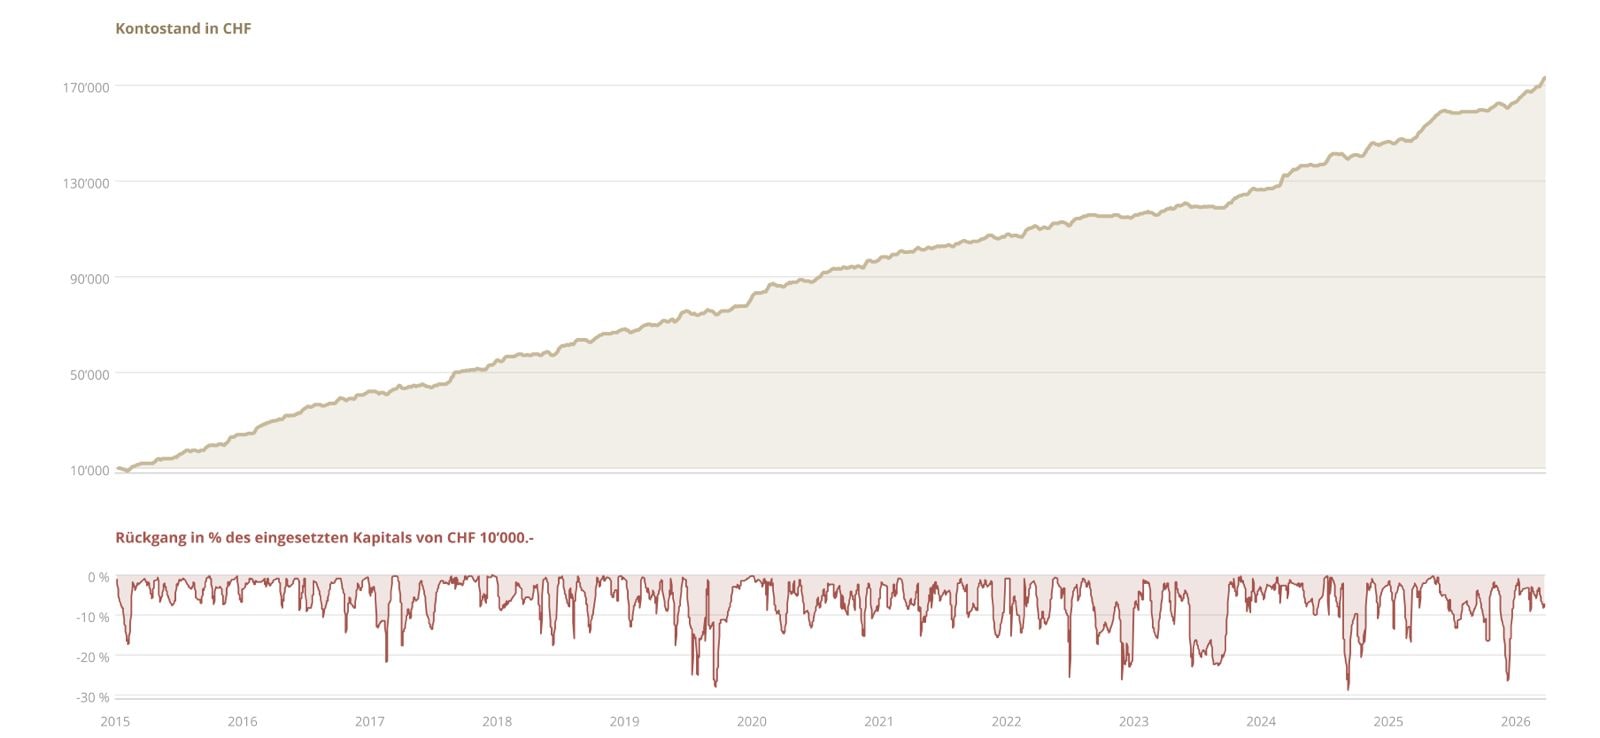
The top chart shows how an account with a starting capital of CHF 10,000 developed. The bottom chart shows each drawdown from the previous high, measured as a percentage of the capital employed. The deepest drawdown was CHF 2,920 or 29.2% and occurred on 12 September 2024. Similarly deep dips happened in 2019, 2022 and 2025.
| Basis of the backtest | |
|---|---|
| Capital employed | CHF 10,000 |
| Test period | 02.01.2015 – 02.04.2026 (11.25 years) |
| Net result | +CHF 161,781 (+1,618%) |
| Ø return per year | +143.8% |
| Largest drawdown | CHF 2,919.90 (29.2%) |
| Costs included | Spread, commission, swap (excluding performance fee) |
| Key figures | |
|---|---|
| Trades | 9,268 |
| Win rate | 61.2% |
| Profit factor | 1.69 |
| Sharpe ratio | 2.81 |
| Ø winning trade / Ø losing trade | +CHF 71.26 / −CHF 66.60 |
| Largest losing trade | −CHF 544.48 |
| Positive months | 108 of 136 (79%) |
No test year ended in negative territory. The weakest year (2022) returned +71.9%, the strongest (2024) +194.5%. On average, the result was +CHF 1,190 per month. The best month brought +CHF 5,339, the weakest −CHF 1,785.
* 2026 covers January to early April.
What would have become of CHF 10,000 if you had simply bought and held gold in January 2015? The comparison covers exactly the same period.
| Buy and hold gold | Breakout Bull (backtest) | |
|---|---|---|
| CHF 10,000 became | CHF 31,608 | CHF 171,781 |
| Total return | +216% | +1,618% |
| Multiple | 3.2× | 17.2× |
| Leverage | no leverage | leveraged trading |
After deducting the 35% performance fee, Breakout Bull would have reached around CHF 115,000 (simplified approximation). That is still more than three and a half times the result of buying gold.
Important: Breakout Bull does not rely on a rising gold price. The strategy trades long and short and profits from price movements, not from holding. It can therefore also generate profits in falling gold markets. The comparison is for context, not a forecast. Physical gold and a leveraged trading strategy have fundamentally different risk profiles.
Gold prices: LBMA Gold Price on 02.01.2015 (CHF 1,172.60 per ounce) and 02.04.2026 (CHF 3,706.38 per ounce), excluding purchase and storage costs.
The backtest was deliberately calculated with a constant working capital of CHF 10,000. Profits are withdrawn continuously; there is no compounding effect. In live trading, by contrast, profits are reinvested unless you withdraw them. Backtest and live results are therefore not directly comparable.
Breakout Bull has been traded on a real account since 10 July 2026. You can follow its current performance at any time.
View live account Start Breakout Bull
You can find the 8-year backtest of Wallstreet Wolf here.